
We tested twenty-eight macro conditions against fourteen years of bitcoin returns to establish which of them have actually mattered. Most of what is widely believed does not survive that testing. One relationship does survive, it appears to be specific to bitcoin in a way we can demonstrate, and it has clear consequences for some institutional portfolios and almost none for others.
This piece sets out what we tested, what failed and why, what held, and which investors it is relevant to. Every condition we examined is reported, including the ones that failed. The full report is available as a PDF, and the workbook behind every chart is published alongside it. Both are linked above.
| Measurement | Reading |
|---|---|
| Macro conditions tested against forward returns | 28 |
| Survived every test we applied | 1 |
| Dollar effect on bitcoin, against US large companies | Roughly eighteen times larger |
| Allocation range where return per unit of risk improved | 1 to 3 percent of a stylised 60/40 portfolio |
There are three things worth knowing before the detail, and each of them is set out in full below.
- Almost everything commonly cited as a driver of the bitcoin price fails when it is tested properly. The four-year halving cycle cannot be assessed with any confidence from four observations. The global money supply relationship, in the form in which it is usually presented, points the wrong way. The version of it that does appear to work turns out to be measuring the exchange rate on both sides of the comparison. Central bank liquidity measures look powerful until the pandemic period is removed from the sample, at which point the effect disappears completely.
- One relationship holds up. Bitcoin returned a median of 121 percent over the following year in months when the dollar had been weakening against other major currencies. Across all months in the record the median was 67 percent. In months when the dollar had been strengthening it was 54 percent. That relationship survives splitting the history in two, reshuffling the data five thousand times, rebuilding the sample from random blocks, removing the pandemic period entirely, and repricing bitcoin in a basket of other currencies.
- The relationship appears to be specific to bitcoin, and specific to the dollar rather than to currencies in general. US shares do respond to the same signal, but bitcoin’s response is roughly eighteen times larger than that of US large companies and eight times larger than that of technology shares. When we test all six major currencies on equal terms, only dollar weakness moves bitcoin. That pattern is consistent with bitcoin behaving as an alternative to the world’s reserve currency, rather than as a risky asset that simply performs well when financial conditions are loose.
This piece is in three parts. The first sets out everything we tested and what happened to each of them, including the results that failed. The second examines what might explain the one result that held, and tests the two most obvious alternative explanations. The third works through what all of this means for different kinds of institutional portfolio, and concludes that the case is strong for some investors and weak for others.
Part one: what we tested, and what happened to it
Twenty-eight conditions, every one of them reported. Most of what is widely believed fails, and the failures are more instructive than the survivor.
We used monthly observations running from May 2013 to August 2026, with daily prices going back to 2010 for the analysis of the halving. For each month in that period we recorded what the world looked like at the end of that month. Separately, we recorded what bitcoin did over the following six, twelve and twenty-four months. That ordering is the whole method. We are never using information that was not available to an investor at the time the condition was observed.
We built the money supply figures ourselves from the central banks’ own publications rather than taking them from a commercial data provider. US M2 comes from the Federal Reserve, euro area M3 from the European Central Bank, UK M4 from the Bank of England, Japanese M2 from the Bank of Japan, and Chinese broad money from the World Bank. Everything else comes from the Federal Reserve’s public database. We did the assembly ourselves because the money supply sits at the centre of the argument this piece examines, and we wanted to be able to check every figure in it.
| Series | Source |
|---|---|
| Bitcoin price | Blockchain.com daily closes from 2010, extended with market data |
| US money supply | Federal Reserve, M2SL |
| Euro area money supply | European Central Bank, BSI M3 |
| UK money supply | Bank of England, LPMAUYM |
| Japan money supply | Bank of Japan, money stock survey |
| China money supply | World Bank, extended with the PBoC depository survey |
| Dollar, yields, spreads, conditions | Federal Reserve Economic Data |
| Fed balance sheet, Treasury account, reverse repo | Federal Reserve Economic Data, weekly |
In total we tested twenty-eight conditions. They cover the dollar measured in several different ways, the money supply measured in several different ways, central bank liquidity including the Federal Reserve’s balance sheet net of the Treasury’s cash account and reverse repurchase balances, real interest rates, inflation expectations, the shape of the yield curve, the term premium, credit spreads, equity market volatility, financial conditions indices, oil, equities, and bitcoin’s own recent price behaviour.
Testing a large number of conditions creates a problem that has to be dealt with directly. If you examine enough ideas, one or two of them will look impressive through luck alone. Any research that reports only the ideas that worked is concealing this, whether deliberately or not. We therefore report every condition we tested, and we apply a correction that asks whether the best of twenty-eight random results would have looked as good as our best real one.
Six ways to break a result
A relationship that appears in data is worth nothing until it has survived deliberate attempts to destroy it. These are the tests we applied to every condition in this piece.
| Test | What it is for |
|---|---|
| Split the history in two | Does it appear in both halves, in market eras that share almost nothing? |
| Reshuffle the labels | Keep the returns, randomly reassign the conditions 5,000 times. How often does chance do as well? |
| Rebuild the sample | Reassemble the history 2,000 times from twelve-month blocks. How much does the answer wobble? |
| Remove the pandemic | Take out March 2020 to December 2021. Does the relationship survive without that one window? |
| Change the measuring stick | Reprice bitcoin in other currencies. Is the effect economic or just arithmetic? |
| Allow for the whole search | We tested 28 conditions. Would the best of 28 random results have looked this good? |
Because forward twelve-month returns measured monthly overlap by eleven months, standard significance tests overstate confidence. Reshuffling and rebuilding are used in their place throughout.
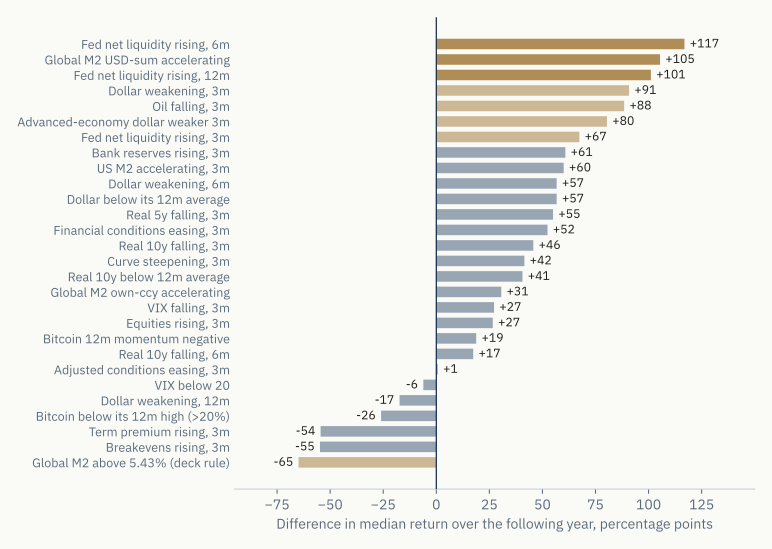
Figure 1. Twenty-eight macro conditions, tested the same way. Dark gold survives allowing for the fact that we tested twenty-eight things at once. Pale gold passes on its own but not after that allowance. Grey is no reliable relationship. Each condition is measured over the previous three, six or twelve months against the following twelve months of bitcoin returns, on the institutional era from July 2019 onward. Sources: Federal Reserve Economic Data, ECB, Bank of England, Bank of Japan, World Bank.
| Condition | Months true | Median return when true | Median return when false | Gap, points | p after allowing for 28 tests | Result |
|---|---|---|---|---|---|---|
| Fed net liquidity rising, 6m | 34 | 120.9% | 4.1% | 117 | 0.011 | Survives the whole-search correction |
| Global M2 USD-sum accelerating | 36 | 94.9% | −10.4% | 105 | 0.035 | Survives the whole-search correction |
| Fed net liquidity rising, 12m | 40 | 79.7% | −21.4% | 101 | 0.048 | Survives the whole-search correction |
| Dollar weakening, 3m | 33 | 120.9% | 30.1% | 91 | 0.134 | Passes alone, fails the whole-search correction |
| Oil falling, 3m | 35 | 84.2% | −4.2% | 88 | 0.196 | Passes alone, fails the whole-search correction |
| Advanced-economy dollar weaker 3m | 37 | 105.7% | 25.2% | 80 | 0.360 | Passes alone, fails the whole-search correction |
| Fed net liquidity rising, 3m | 39 | 83.5% | 16.2% | 67 | 0.664 | Passes alone, fails the whole-search correction |
| Bank reserves rising, 3m | 36 | 105.0% | 44.3% | 61 | 0.827 | No reliable relationship |
| US M2 accelerating, 3m | 46 | 65.4% | 5.4% | 60 | 0.833 | No reliable relationship |
| Dollar below its 12m average | 32 | 94.9% | 38.2% | 57 | 0.902 | No reliable relationship |
| Dollar weakening, 6m | 28 | 94.9% | 38.2% | 57 | 0.902 | No reliable relationship |
| Real 5y falling, 3m | 37 | 80.2% | 25.2% | 55 | 0.921 | No reliable relationship |
| Financial conditions easing, 3m | 38 | 82.2% | 29.8% | 52 | 0.966 | No reliable relationship |
| Real 10y falling, 3m | 36 | 79.7% | 34.0% | 46 | 0.998 | No reliable relationship |
| Curve steepening, 3m | 43 | 71.0% | 29.4% | 42 | 1.000 | No reliable relationship |
| Real 10y below 12m average | 31 | 79.2% | 38.6% | 41 | 1.000 | No reliable relationship |
| Global M2 own-ccy accelerating | 40 | 57.9% | 27.3% | 31 | 1.000 | No reliable relationship |
| VIX falling, 3m | 42 | 65.4% | 38.2% | 27 | 1.000 | No reliable relationship |
| Equities rising, 3m | 53 | 56.1% | 29.4% | 27 | 1.000 | No reliable relationship |
| Bitcoin 12m momentum negative | 17 | 68.7% | 49.9% | 19 | 1.000 | No reliable relationship |
| Real 10y falling, 6m | 37 | 56.1% | 38.6% | 17 | 1.000 | No reliable relationship |
| Adjusted conditions easing, 3m | 41 | 55.0% | 54.3% | 1 | 1.000 | No reliable relationship |
| VIX below 20 | 43 | 49.9% | 56.1% | −6 | 1.000 | No reliable relationship |
| Dollar weakening, 12m | 31 | 37.8% | 55.1% | −17 | 1.000 | No reliable relationship |
| Bitcoin below its 12m high (>20%) | 25 | 30.1% | 56.1% | −26 | 1.000 | No reliable relationship |
| Term premium rising, 3m | 42 | 27.4% | 81.9% | −54 | 0.939 | No reliable relationship |
| Breakevens rising, 3m | 41 | 16.2% | 71.0% | −55 | 0.933 | No reliable relationship |
| Global M2 above 5.43% (deck rule) | 30 | −9.4% | 55.6% | −65 | 0.722 | Passes alone, fails the whole-search correction |
Two features of that chart deserve comment. The first is that only a small number of the twenty-eight conditions clear the bar once the size of the search is taken into account. The second is that several of the apparent winners then fail a further test which we regard as more important than any statistical threshold, and which we describe below.
What failed, and why the failures matter
The halving. Four halvings have taken place. The twelve months following each of them produced returns of roughly 7,620 percent, 287 percent, 559 percent and 33 percent. There is no orderly pattern in those numbers, because the 2020 result was roughly twice the 2016 result. The figures also move by a factor of three if the starting date is shifted by a few weeks in either direction, which means they cannot be pinned down with any precision. Most importantly, each halving arrived alongside something else large enough to have moved the price on its own, most obviously the monetary response to the pandemic in 2020 and the approval of American spot funds in early 2024. With only four observations there is no way to separate the effect of the supply change from the effect of everything else happening at the same time. The issuance schedule is real, verifiable and unchangeable. It is not something an investor can use to decide when to buy.
The money supply, as it is usually described. The familiar claim is that a high rate of money growth lifts the bitcoin price. We tested that claim directly by splitting months into those where money growth was above its historical average and those where it was below, then looking at what followed. The result comes out backwards. Months of above-average growth were followed by a median return of minus 2 percent, and months of below-average growth by a median of plus 86 percent. The explanation is not complicated. Money growth reaches its highest rate shortly after a large monetary response, by which time markets have generally already reacted to it. A rule that buys when money growth is already fast is a rule that buys late.
The money supply, in the form we would have preferred to publish. Asking a different question, whether the pace of money growth is picking up or easing off rather than whether it is high, produces a strong result. We came close to publishing it. Before doing so we examined how the aggregate had been constructed. Converting European, British and Japanese money stocks into dollars and adding them together means that a weaker dollar mechanically increases the total, regardless of whether any money has been created. The resulting series has a correlation of minus 0.70 with the dollar itself. When we rebuilt it properly, measuring each region’s money growth in its own currency and then weighting by size, the relationship weakened to the point where it is no longer significant. A substantial part of what is presented publicly as a global liquidity relationship is the exchange rate appearing on both sides of the comparison.
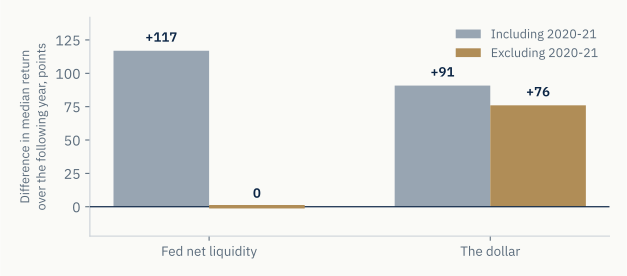
Central bank liquidity. The strongest single result in the entire search was the Federal Reserve’s balance sheet net of the Treasury’s cash balance and reverse repurchase agreements, which is a reasonable measure of the cash actually left circulating in the financial system. It separated a difference of 117 percentage points in the returns of the following year. We then removed the period from March 2020 to December 2021 and ran it again. The difference fell to zero, precisely: a median of 55 percent under both conditions. Measured from 2022 onwards it is minus 2 percentage points. The measure describes one extraordinary period rather than a durable relationship, and the same proved true of every liquidity variable we tested.
Figure 2. One survives the removal of the pandemic. The other does not. Liquidity measures look powerful until March 2020 to December 2021 is taken out, when the effect falls to nothing. The dollar relationship is essentially unchanged by removing the same period. Same test, same horizon, same sample except for the excluded window. Source: Federal Reserve Economic Data.
| Measure | Gap with March 2020 to December 2021 included, points | Gap with that window excluded, points |
|---|---|---|
| Fed net liquidity | 117 | 0 |
| The dollar | 91 | 76 |
That chart is the most useful in this section, because it explains why so much macro analysis of bitcoin sounds convincing and yet does not hold. A single twenty-one month window, during which the Federal Reserve expanded its balance sheet on an unprecedented scale and bitcoin rose roughly sevenfold, is doing all of the work. Any measure that captures that window looks excellent. Almost none of them work outside it. This is the test we would encourage any reader to apply to liquidity-based research they are shown by anybody, including us.
What held, and how hard we tried to break it
In months when the dollar had weakened against other major currencies over the previous three months, bitcoin returned a median of 121 percent over the following year. In months when it had strengthened, the median was 54 percent. The difference between the two is 67 percentage points. This is the full sample. Two other windows appear in this piece and give different figures for the same relationship: the institutional era from July 2019, used in Figure 1 and Figure 2 because the twenty-eight conditions are not all available before it, and a 145-month window from August 2013, used in Figure 3 because it is the longest period over which every asset compared can be measured identically. All three are stated where they are used.
We then set about trying to destroy that result. Splitting the record in half, it appears in both halves, in two market eras that have very little in common. Reshuffling which months count as dollar-weakening months, five thousand times over, chance produced a difference that large about once in every hundred attempts. Rebuilding the history two thousand times from randomly drawn twelve-month blocks, the difference remained positive in 98 percent of those rebuilds. Removing March 2020 to December 2021, the window that eliminated every liquidity measure, the difference was 65 percentage points rather than 67, which is essentially unchanged.
One further test could have ended this piece. Bitcoin is quoted in dollars, so a weaker dollar mechanically makes the bitcoin price look larger without anything real having happened. We rebuilt the entire price history in a basket of euros, yen, pounds, Swiss francs and Canadian dollars, and repeated the test on that. If the effect had been arithmetic it would have largely disappeared. Instead the difference widened slightly, to 78 percentage points. When the dollar falls, bitcoin has gained ground against other currencies as well, not merely against the dollar.
The limits of what we found. The relationship does not survive the full correction for having tested twenty-eight conditions, which means we cannot rule out luck on statistical grounds alone. Taken in isolation, the window from 2022 onwards shows a difference of 30 percentage points that is not statistically significant, although that window contains barely three independent years of data. What persuades us is not any single number. It is that this relationship survived every test that destroyed all the others.
Part two: why the dollar, rather than something else
A statistical relationship without a credible mechanism is a fragile thing to build an investment case on. We tested the two most obvious alternatives instead of asserting an explanation.
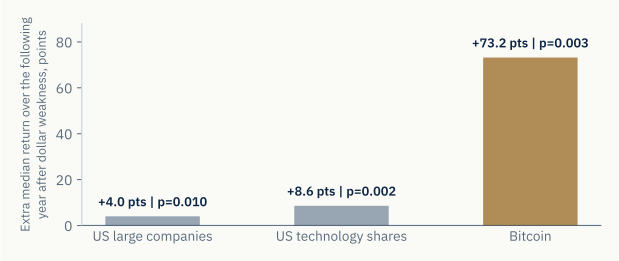
The first alternative is that a weak dollar simply lifts risky assets in general, by making funding conditions easier around the world. This is a real and well documented channel and there is a substantial economic literature on it. If it were the explanation here, then shares ought to show the same pattern that bitcoin shows, at a broadly similar size. The same test applied to US large companies produces a difference of about 4 percentage points, and applied to US technology shares about 9 percentage points, against bitcoin’s 73.
Equities do respond to the same signal, and the relationship is statistically solid for both indices. What separates bitcoin is the size of the response, which is roughly eighteen times that of US large companies and eight times that of technology shares. A shared funding channel would produce effects of broadly similar magnitude across the three. That is not what the data shows.
Figure 3. It is not simply that a weak dollar lifts risky assets. The same test applied to each asset over one identical sample of 145 months, August 2013 to August 2025, with 61 months of dollar weakening and 84 of strengthening. The effect is roughly eighteen times larger for bitcoin than for US large companies, and about eight times larger than for technology shares. Sources: Federal Reserve Economic Data, market data.
| Asset | Months of dollar weakening | Months of dollar strengthening | Median return after weakness | Median return after strength | Gap, points | p |
|---|---|---|---|---|---|---|
| Bitcoin | 61 | 84 | 120.9% | 47.7% | 73.2 | 0.003 |
| US technology shares | 61 | 84 | 23.7% | 15.1% | 8.6 | 0.002 |
| US large companies | 61 | 84 | 15.3% | 11.3% | 4.0 | 0.010 |
The second alternative is that the whole thing is arithmetic, the denomination effect described in the previous section. The currency basket test rules that out, because the effect became larger rather than smaller when bitcoin was measured in other currencies.
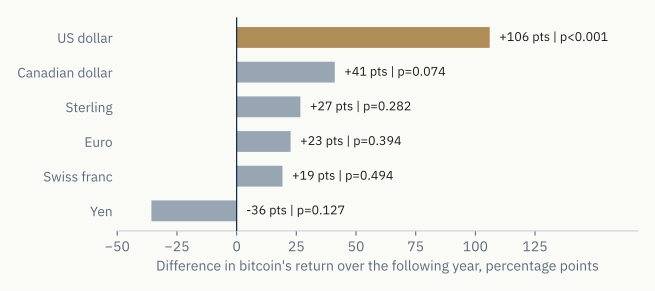
That leaves a third possibility, and we designed a specific test for it. If bitcoin responds to a currency losing value, then any major currency weakening ought to produce the effect. If instead bitcoin responds to the dollar in particular, then only the dollar will produce it. We measured each of six major currencies against the other five, and asked what bitcoin did over the following year. Bitcoin was priced in the same fixed basket of all six currencies in every case, so that no currency enjoyed a mechanical advantage over any other.
Figure 4. Only the dollar does this. Each row asks the same question: when this currency weakens against the other five, what does bitcoin do next? Bitcoin is measured in the same fixed basket every time, so no currency gets a mechanical advantage. 148 monthly observations, bitcoin priced as the geometric average across all six currencies. Sources: Federal Reserve Economic Data, Blockchain.com.
| Currency that weakened | Months it weakened | Months it did not | Median bitcoin return when it weakened | Median return when it did not | Gap, points | p |
|---|---|---|---|---|---|---|
| US dollar | 59 | 89 | 148.1% | 42.1% | 106 | <0.001 |
| Canadian dollar | 67 | 81 | 89.3% | 48.2% | 41 | 0.074 |
| Sterling | 66 | 82 | 79.3% | 52.6% | 27 | 0.282 |
| Euro | 67 | 81 | 77.8% | 55.2% | 23 | 0.394 |
| Swiss franc | 61 | 87 | 78.7% | 59.5% | 19 | 0.494 |
| Yen | 86 | 62 | 51.4% | 87.1% | −36 | 0.127 |
Only the dollar registers, at 106 percentage points. The Canadian dollar comes next at 41 percentage points, and the Canadian dollar is itself closely tied to the US dollar. Sterling, the euro and the Swiss franc are all indistinguishable from nothing, and the yen is negative. Bitcoin is not responding to currency debasement in general. It is responding to the dollar specifically.
The reading we find most plausible is that this reflects the dollar’s position in the world rather than its price. The dollar is the currency in which most international trade is invoiced, most cross-border debt is issued, and most official reserves are held. A weakening euro is a European matter. A weakening dollar is information about the monetary system that every institution operates inside, and bitcoin is the one large asset that was designed explicitly as an alternative to that system.
We would not claim that this is proved. Dollar movements explain roughly a fifth of the variation in bitcoin’s twelve-month returns, which leaves four fifths explained by something else. Our data also cannot fully separate the dollar’s role as the reserve currency from the fact that American monetary policy drives the global financial cycle, and those two things are related but not identical. What we can say is that the two obvious alternative explanations have both been tested and both fail, which is a stronger position than most macro narratives about this asset are able to claim.
What we will not do: forecast the dollar
The obvious next question is where the dollar goes from here, and it is the question we are asked most often. We are not going to answer it, and the reason is in our own data rather than in modesty.
We tested how predictable the dollar’s direction actually is. If it has weakened over the past three months, the probability that its direction is unchanged one month later is 51 percent. At three months it is 49 percent, at six months 52 percent, and at twelve months 50 percent. Those are coin tosses at every horizon. The correlation between one month’s move and the next is 0.06. That exchange rates are close to unforecastable is one of the most durable findings in economics, established more than forty years ago and repeatedly confirmed since. Nothing in our data suggests it has changed.
Figure 5. The gauges describe the present, they do not forecast it. Left: the moves happen together, not in sequence. Right: the dollar’s direction is a coin toss at every horizon. Money growth’s persists for a few months and is gone by twelve. The dashed rule is a coin toss. Sources: Onramp Terminal, Federal Reserve Economic Data.
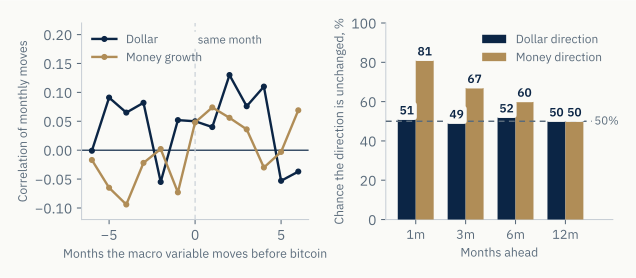
| Months ahead | Chance the dollar’s direction is unchanged | Chance money growth’s direction is unchanged |
|---|---|---|
| 1 | 51% | 81% |
| 3 | 49% | 67% |
| 6 | 52% | 60% |
| 12 | 50% | 50% |
| Months the macro variable moves before bitcoin | Correlation with a weaker dollar | Correlation with a change in money growth |
|---|---|---|
| −6 | −0.001 | −0.017 |
| −5 | 0.091 | −0.065 |
| −4 | 0.065 | −0.094 |
| −3 | 0.082 | −0.022 |
| −2 | −0.055 | 0.002 |
| −1 | 0.052 | −0.073 |
| 0 | 0.050 | 0.048 |
| 1 | 0.040 | 0.074 |
| 2 | 0.130 | 0.056 |
| 3 | 0.076 | 0.036 |
| 4 | 0.110 | −0.030 |
| 5 | −0.053 | −0.003 |
| 6 | −0.037 | 0.069 |
We are also sceptical of the specific arguments most often advanced for a weaker dollar, not because they are unreasonable but because one of them has already been tested by events. The clearest case of the reserve currency being used as an instrument of policy was the freezing of Russian foreign exchange reserves in February 2022. Many observers argued at the time that this would accelerate a move away from the dollar and weaken it. Over the following eight months the dollar rose about eleven percent, and a year after the freeze it was still five percent above where it had started. It remains slightly above its February 2022 level today, more than four years later.
Figure 6. The dollar was used as an instrument of policy in 2022, and then it rose. Freezing Russian reserves was the clearest case of the reserve currency being turned into a policy tool. Many expected the dollar to weaken as a result. It rose about eleven percent to its peak eight months later, and was still five percent higher a year on. Broad trade-weighted US dollar index, monthly. Source: Federal Reserve Economic Data.
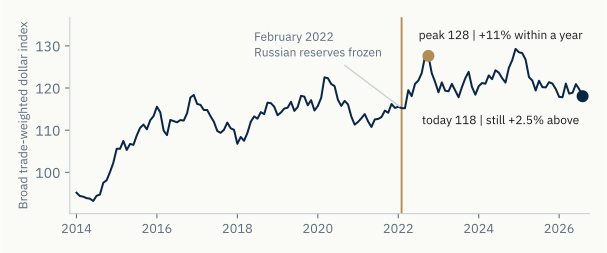
| Month | Broad trade-weighted dollar index |
|---|---|
| January 2014 | 95.2 |
| January 2015 | 105.6 |
| January 2016 | 115.6 |
| January 2017 | 116.2 |
| January 2018 | 106.8 |
| January 2019 | 113.5 |
| January 2020 | 115.7 |
| January 2021 | 112.0 |
| January 2022 | 115.6 |
| February 2022, Russian reserves frozen | 115.2 |
| October 2022, the peak within a year of the freeze | 127.6 |
| February 2023, a year after the freeze | 121.3 |
| January 2024 | 120.4 |
| December 2024, the highest month in the series | 129.3 |
| January 2025 | 128.5 |
| January 2026 | 117.9 |
| August 2026, latest | 118.1 |
The related argument about reserve holdings deserves the same scrutiny. The dollar’s share of global official reserves has fallen substantially over the past two decades. Over that same period the broad dollar index rose by about 19 percent. Reserve share and exchange rate are different things, and a fall in one is not evidence of a fall in the other.
The fiscal argument also runs in both directions more than is usually acknowledged. Large deficits financed at high real yields can attract foreign capital as easily as they repel it, and that is roughly what has happened in recent years: long-term yields near their highest in two decades alongside a dollar that has drifted gently upwards at about one percent a year over twenty years.
None of this means the pressures are imaginary. Sanctions policy, the fiscal position, the growth of alternative settlement arrangements and the management of the long end of the Treasury market are all real, and they are all reasons a thoughtful investor might expect the dollar to come under strain. Our point is narrower and, we think, more useful. These arguments are widely held and therefore already reflected in the price to some degree, they have been made for many years without being borne out, and the case for a small bitcoin allocation does not require any of them to be correct.
An allocation that depends on a directional currency forecast is a bet. An allocation that benefits from an outcome you cannot rule out, sized so that being wrong costs little, is a hedge. Only the second is defensible from the evidence in this piece.
That is the argument we would put to an investment committee. A position of this kind pays off if the dollar weakens. It does not require anyone to predict that it will.
Part three: what this means for a portfolio
The implication is not the return. It is that bitcoin has responded to something the rest of an institutional portfolio does not respond to.
The investment implication does not come from the return, because returns are not forecastable and nothing in this piece should be read as an expectation of future performance. It comes from the finding that bitcoin has responded to something the rest of an institutional portfolio does not respond to. That is a diversification argument, and it is the only argument this research supports.
Consider a conventional portfolio of 60 percent equities and 40 percent bonds over the period from June 2013 to August 2026. On its own it returned 7.3 percent a year with volatility of 9.0 percent. Adding a 3 percent bitcoin position, funded by scaling down the rest proportionally, raises the return to 9.7 percent with volatility of 10.5 percent. A 5 percent position gives 11.2 percent and 12.5 percent. Return per unit of risk improves up to roughly 3 percent and deteriorates beyond it. At a 10 percent allocation the volatility of the whole portfolio has doubled and the investor is no better rewarded for the risk being carried than they were with no position at all.
Figure 7. Small positions improve the portfolio. Large ones stop improving it. A 60/40 portfolio, June 2013 to August 2026, with a bitcoin position added and the rest scaled down proportionally. By ten per cent the volatility has doubled and the portfolio is no better rewarded for the risk it carries. Past behaviour of a stylised portfolio, not a recommendation. Sources: market data, Federal Reserve Economic Data.
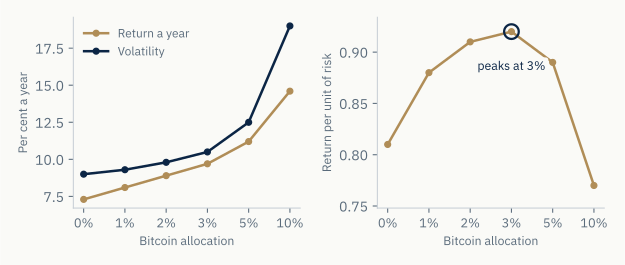
| Bitcoin allocation | Return a year | Volatility | Return per unit of risk | Worst peak-to-trough |
|---|---|---|---|---|
| 0% | 7.3% | 9.0% | 0.81 | −16.1% |
| 1% | 8.1% | 9.3% | 0.88 | −16.1% |
| 2% | 8.9% | 9.8% | 0.91 | −16.1% |
| 3% | 9.7% | 10.5% | 0.92 | −16.1% |
| 5% | 11.2% | 12.5% | 0.89 | −16.1% |
| 10% | 14.6% | 19.0% | 0.77 | −18.7% |
For an investor whose currency is pegged to the dollar, the comparison looks different again, because the relevant measure is not the nominal return but what the money will buy internationally. On that basis the plain portfolio returned 5.6 percent a year over the period, and the same portfolio with a 5 percent bitcoin position returned 9.4 percent. In the periods when the dollar was actually falling, the figures were 18.5 percent and 27.6 percent respectively.
The counterweight, which belongs in front of a committee before a position is taken. Every twelve-month period in bitcoin’s measurable history has contained a fall of at least 20 percent from a recent high, without a single exception, and the median such fall is around 50 percent. The worst twelve-month return in our sample was minus 78 percent. A 3 percent position that loses three quarters of its value costs a little over 2 percent of the total portfolio. That is a poor quarter rather than a serious event, and that is exactly why the position should be small enough that the investor can afford to be wrong about it.
Who this suits, and who it does not
Judged on three things: whether the currency exposure applies, whether the horizon can absorb a long recovery, and whether rules or capital charges permit the position at all.
| Investor type | Verdict | Reason |
|---|---|---|
| Gulf family offices | Strong | Pegged currency, no capital charge, long horizon, full discretion |
| Gulf sovereign funds | Strong | Same currency exposure at scale, and governance is the constraint |
| Endowments, foundations | Good | Perpetual horizon absorbs a two to three year recovery |
| Family offices elsewhere | Moderate | Diversification holds, but the currency argument is weaker without a peg |
| Defined benefit pensions | Limited | Liabilities are fixed sums at home, which this does not hedge |
| Insurance portfolios | Constrained | Capital rules make the cost prohibitive at almost any size |
The differences between investor types here are structural rather than a matter of appetite or sophistication, so it is worth setting out the reasoning in each case.
Gulf family offices. This is the strongest case, and it follows directly from the research rather than from enthusiasm. Their currency is pegged to the dollar, which means the single variable most associated with bitcoin’s returns is also the variable that determines what their wealth will buy outside the region. That exposure cannot be diversified away using domestic assets, because the peg is the whole point of the arrangement. Their existing holdings are already tilted the same way: oil and Saudi equities have both performed better after periods of dollar weakness, by roughly 10 and 9 percentage points respectively. Despite that, bitcoin’s correlation with those assets is low, between 0.09 and 0.15, so a small position diversifies the portfolio rather than adding to an existing exposure. They also face no regulatory capital charge, no funding ratio to maintain, and no quarterly board scrutiny, and they can hold a position through a recovery lasting two or three years.
Gulf sovereign wealth funds. The same currency logic applies, at very much greater scale. Here the binding constraint is governance and public disclosure rather than the investment case itself. A position that is trivial as a percentage of the fund becomes conspicuous in absolute terms, and the drawdown history needs to be understood and accepted by the ultimate owner before it happens rather than after.
Endowments and foundations. A good case, for different reasons. They have no liabilities to match, a perpetual investment horizon, and spending rules expressed in real terms. The recovery periods we measured, of twenty to thirty-five months for the four largest declines in bitcoin’s history, are survivable for this type of investor in a way that they are not for most others.
Family offices outside the Gulf. A moderate case. They have the same freedom of action and the same long horizon as their Gulf counterparts, but their currency floats against the dollar, so the specific argument about pegged purchasing power does not apply to them. Their case rests on diversification and portfolio efficiency alone. That is real, but it is less compelling than the currency argument.
Defined benefit pension funds. A limited case, and the reason has nothing to do with the merits of the asset. Their obligations are fixed sums payable in their home currency at known dates, and bitcoin does not hedge that. What it does is add volatility to a funding ratio that is measured quarterly and scrutinised by trustees and regulators. A position of around 1 percent within a return-seeking allocation is defensible on diversification grounds. Presenting it as a liability hedge would not be.
Insurance portfolios. The most constrained of all. Under the capital regimes that insurers operate within, the charge applied to an asset of this volatility makes the return on required capital unattractive at almost any position size, whatever the diversification benefit might be. This is a regulatory constraint rather than a research finding, and current rules in the relevant jurisdiction should be confirmed before anyone acts on it.
One practical point applies to every category above and is too often treated as an afterthought. For a long-horizon holder, the custody arrangements and the succession planning matter more than the precise size of the allocation. A position that cannot be recovered when a principal dies or an authorised signatory changes is not a 2 percent allocation. It is a 2 percent loss waiting to happen.
What would change our view
We would revise this analysis on any of the following evidence. A sustained decline in the relationship between bitcoin and the dollar, which would indicate that the pattern we have described has ended. Failure of the dollar relationship across the next eight quarters of data that we have not yet seen, which we will publish whatever the result turns out to be. Or a change in the composition of who owns the asset on a scale comparable to the arrival of American spot funds in 2024.
We would also revise it if a reader can demonstrate that our construction is wrong. That is not a formality. We found an error of exactly that kind in our own work while preparing this piece. A money supply series we had built ourselves turned out to be measuring the dollar twice, through the currency conversion, and correcting it removed a finding we had been ready to publish.
A disclosure. Onramp MENA intends to apply for a licence to provide bitcoin custody in Bahrain, so a conclusion favourable to bitcoin is what a reader should expect from us. That is a reason to check our figures rather than to accept them. Every number in this piece comes from the public sources named above, and the workbook behind every chart is published alongside it. We would rather be judged on whether they can be replicated.
Appendix: the working
Monthly observations, May 2013 to August 2026. Daily closing prices from August 2010 for the halving analysis. The comparison of bitcoin against equities in Part two uses a single identical sample of 145 months, August 2013 to August 2025, so that all three assets are measured on the same months.
Money aggregates constructed from Federal Reserve (M2SL), European Central Bank (BSI M3), Bank of England (LPMAUYM), Bank of Japan (money stock survey) and World Bank (FM.LBL.BMNY.CN, PA.NUS.FCRF) releases, each converted to US dollars. Dollar indices, real yields, inflation breakevens, term premium, credit spreads, equity volatility, financial conditions indices, Federal Reserve balance sheet, Treasury General Account and reverse repurchase balances from Federal Reserve Economic Data. Bitcoin prices from Blockchain.com extended with market data.
Conditions are measured as changes over the previous three, six or twelve months as at each month-end. Returns are measured strictly forward from that point. Because forward twelve-month windows measured monthly overlap by eleven months, conventional significance tests overstate confidence. All inference uses permutation tests (5,000 iterations) and block bootstrap resampling (2,000 iterations, twelve-month blocks), with a maximum-statistic correction applied across the family of twenty-eight conditions. Portfolio figures use a 60/40 blend of the S&P 500 and a broad US bond index, rebalanced monthly.
The workbook behind the charts is published alongside this piece, one tab per figure or table, with a read-me tab that maps each tab to its figure. Figures quoted in the text alone, including the survivor result, are described in the method above rather than tabulated.
References
- Federal Reserve Economic Data, for the dollar indices, real yields, inflation breakevens, term premium, credit spreads, equity volatility, financial conditions indices, the Federal Reserve balance sheet, the Treasury General Account and reverse repurchase balances.
- Federal Reserve (M2SL), European Central Bank (BSI M3), Bank of England (LPMAUYM), Bank of Japan (money stock survey) and World Bank (FM.LBL.BMNY.CN, PA.NUS.FCRF), for the money aggregates.
- Blockchain.com, for daily bitcoin closes from 2010, extended with market data.
- The workbook behind the charts, published alongside this piece as an XLSX download.
Frequently asked questions
What actually moves the bitcoin price?
Of twenty-eight macro conditions tested against fourteen years of returns, one relationship survived every test: the direction of the US dollar. In months when the dollar had weakened against other major currencies over the previous three months, bitcoin returned a median of 121 percent over the following year. In months when it had strengthened, the median was 54 percent. The relationship survives splitting the history in two, reshuffling the data five thousand times, rebuilding the sample from random blocks, removing the pandemic period and repricing bitcoin in a basket of other currencies.
Does the halving move the bitcoin price?
Not in any way that can be measured with confidence. Four halvings have taken place, and the twelve months after each produced returns of roughly 7,620 percent, 287 percent, 559 percent and 33 percent. There is no orderly pattern in those numbers, the figures move by a factor of three if the starting date is shifted by a few weeks, and each halving arrived alongside something else large enough to have moved the price on its own. The issuance schedule is real, verifiable and unchangeable. It is not something an investor can use to decide when to buy.
Does the global money supply drive the bitcoin price?
Not in the form in which it is usually presented. Months of above-average money growth were followed by a median return of minus 2 percent, and months of below-average growth by a median of plus 86 percent. The version that appears to work, the pace of money growth picking up, turns out to be measuring the exchange rate on both sides of the comparison: converting foreign money stocks into dollars means a weaker dollar mechanically increases the total. Rebuilt in local currencies and weighted by size, the relationship is no longer significant.
Does central bank liquidity explain bitcoin returns?
Only inside one window. The Federal Reserve balance sheet net of the Treasury cash balance and reverse repurchase agreements separated a difference of 117 percentage points in the returns of the following year. With March 2020 to December 2021 removed, the difference falls to zero, a median of 55 percent under both conditions. Measured from 2022 onwards it is minus 2 percentage points. The same proved true of every liquidity variable tested.
Is the dollar effect on bitcoin just arithmetic, because bitcoin is priced in dollars?
No. Rebuilding the entire price history in a basket of euros, yen, pounds, Swiss francs and Canadian dollars widened the difference to 78 percentage points rather than removing it. Tested on equal terms, only dollar weakness moves bitcoin: the dollar registers at 106 percentage points, the Canadian dollar at 41, and sterling, the euro and the Swiss franc are indistinguishable from nothing. US shares respond to the same signal, but bitcoin's response is roughly eighteen times that of US large companies and eight times that of technology shares.
Can the direction of the dollar be forecast?
Not from this data. If the dollar has weakened over the past three months, the probability that its direction is unchanged one month later is 51 percent, and 49, 52 and 50 percent at three, six and twelve months. Those are coin tosses at every horizon. The clearest recent argument for a weaker dollar, the freezing of Russian foreign exchange reserves in February 2022, was followed by a rise of about eleven percent to the dollar's peak eight months later, and the index remains slightly above its February 2022 level today.
How large a bitcoin position improved a 60/40 portfolio in the study?
In a stylised portfolio of 60 percent equities and 40 percent bonds from June 2013 to August 2026, return per unit of risk improved up to roughly a 3 percent bitcoin position and deteriorated beyond it. A 3 percent position raised the return from 7.3 to 9.7 percent a year, with volatility rising from 9.0 to 10.5 percent. At a 10 percent allocation the volatility of the whole portfolio had doubled. That is the past behaviour of a stylised portfolio, not a recommendation, and every twelve-month period in bitcoin's measurable history has contained a fall of at least 20 percent from a recent high.
What actually moves the bitcoin price
Leave your email and the download starts right away. New research from the desk will reach the same inbox.
Unsubscribe anytime. Handled per the privacy notice.
This article is published as research and analysis. It does not constitute legal, regulatory, financial, or investment advice and should not be relied upon in connection with any specific transaction or licensing strategy. Readers should seek their own qualified counsel. Where specific products, providers or jurisdictions are named, they are referenced factually on the basis of public information, for analysis, and not as endorsements.